IP DAVINCI CONTINUATION PROGRAM
Graphs & Charts Mastery™
- ✓ Part of the IP DaVinci System™
- ✓ Self-Paced Online Training
- ✓ Graph Elements Stencil™
- ✓ Immediate Access
CONTINUATION PROGRAM
WHY GRAPHS MATTER
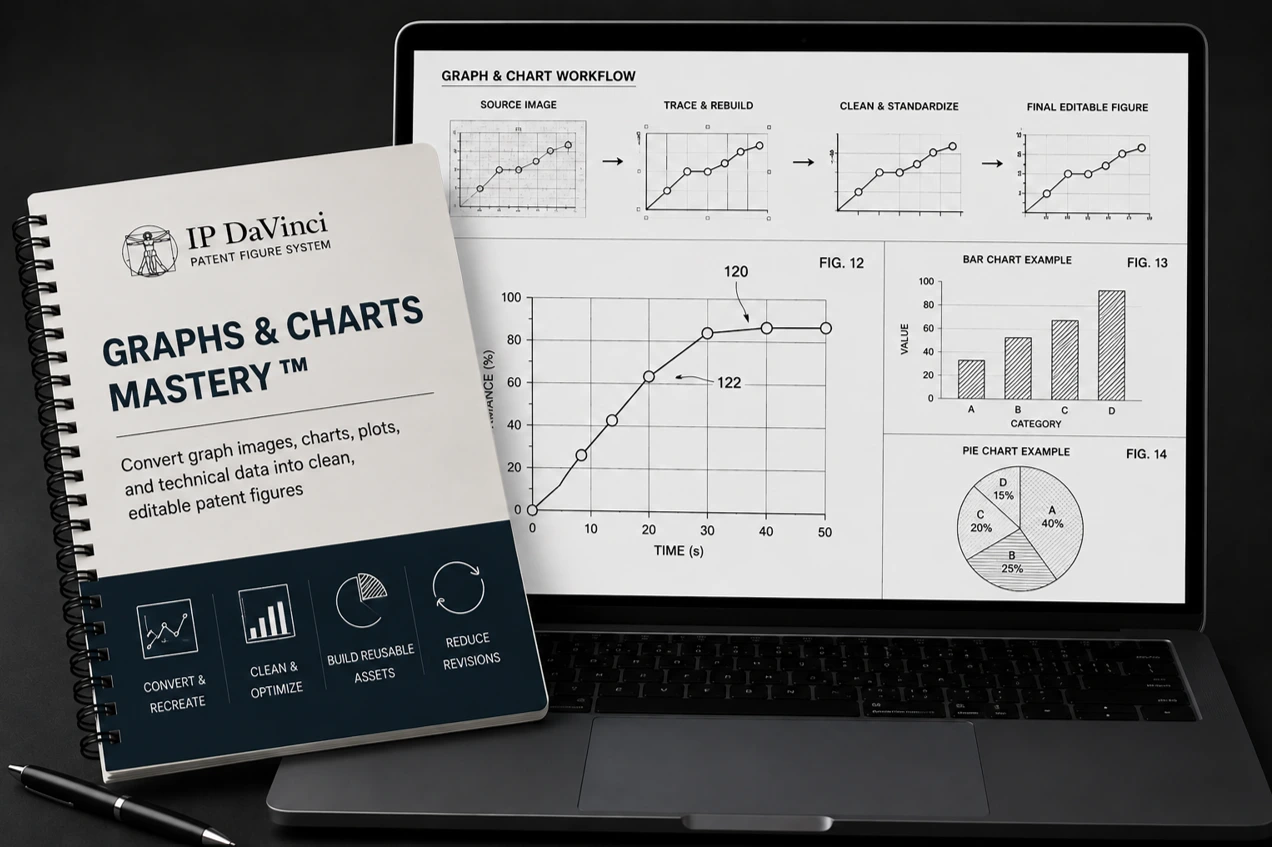
Convert Data Into Editable Patent Figures
Sources
- Research reports
- Laboratory results
- CAD exports
- Scientific publications
- Screenshots
Tools
- Graph Elements Stencil™
- Reusable axes
- Data markers
- Tracing layers
- Graph templates
Workflows
- Graph Tracing Workflow™
- Layer organization
- Curve recreation
- Annotation workflows
- Quality control
Benefits
- Create editable assets
- Reduce revision time
- Improve readability
- Increase consistency
- Enable reuse
Who Should Attend
Designed for professionals who create, review, revise, or manage graphs, charts, and data-driven patent figures.
Why Learn Patent Graph Development
Most Graphs Are Static Images
Graphs are often supplied as screenshots, exported images, reports, and publication figures that are difficult to revise and annotate.
Editable Graphs Create Flexibility
Recreating graphs as editable vector assets makes future revisions, updates, and annotations significantly easier.
Better Graphs Improve Communication
Clear, consistent graph figures help communicate technical results more effectively.
What You Will Learn
Practical instruction focused on recreating graphs and charts as editable patent figures.
Graph Tracing Workflow™
- • Layer Setup
- • Image Layer Management
- • Layer Locking
- • Red Tracing Layer
- • Workflow Organization
- • Quality Control
- • Figure Finalization
Graph Recreation Techniques
- • Axes
- • Tick Marks
- • Tick Labels
- • Axis Labels
- • Grid Lines
- • Data Curves
- • Data Markers
- • Graph Annotation
- • Reusable Components
Course Details
Everything needed to develop practical graph and chart recreation skills for patent figure work.
What's Included
- ✓ eLearning Modules
- ✓ Practice Exercises
- ✓ Graph Elements Stencil™
- ✓ Downloadable Resources
Program Format
WHY IP DAVINCI
A Different Approach To Graph Figures
Learn structured graph recreation workflows instead of relying on screenshots and static images.
Reusable Graph Components
Create reusable axes, labels, markers, and graph elements that improve efficiency and consistency.
Built For Editing
Produce editable graph assets designed for future revisions, updates, and annotations.
Cleaner Results
Create professional patent figures with improved consistency and readability.
Practical Workflow
Learn repeatable techniques that can be applied immediately to real patent applications.
FAQ
Frequently Asked Questions
Answers to common questions about Graphs & Charts Mastery™.
Do I need Visio experience?
How long does the program take?
What types of graphs are covered?
Will I learn vector-based graph recreation?
Where does this fit within the IP DaVinci System™?
Ready To Master Patent Graph Figures?
Graphs & Charts Mastery™ $99 Includes: eLearning Modules, Practice Exercises, Graph Elements Stencil™, and Downloadable Resources.